M&A Premiums and Why They Move
M&A premiums sit at 20-35% on average. The range hides everything. What moves premiums up, what moves them down, and how to defend one.
The standard answer to "what's a typical M&A premium" is 20–35%.
That answer is approximately correct: on average, in normal market conditions, for normal deals between normal counterparties. None of those qualifiers are usually understood by the candidate who gives the answer.
Premium analysis at the senior level is about understanding the qualifiers, not the headline range. Microsoft paid 45% for Activision. BMS paid 54% for Celgene. Take-Two paid roughly 64% for Zynga. None of those sat within the textbook range, and all of them were defensible: for different reasons, in different bidding structures, against different synergy profiles. The candidates who can defend a specific premium are the ones who understand why it's where it is. The candidates who recite "20 to 35%" and stop are the ones who get pushed in interviews until they fold.
This piece walks why premiums are where they are, when they move, and what an interviewer expects when they ask "is 45% reasonable?"
What a Premium Actually Is
The formula is the easy part:
Premium = (Offer Price − Unaffected Price) / Unaffected PriceThe unaffected price question is where candidates fumble first. Unaffected means the trading price before any deal speculation leaked into the market. Convention is the price one trading day before announcement. But premium analyses also routinely report 30-day and 60-day premiums (the prices from a month and two months before) to wash out leak.
The leak issue matters more than candidates realize. If a deal is rumored for two weeks before the announcement, the stock typically runs up 5–15% on the speculation. The "1-day unaffected" premium then understates the real premium because the day-before price is already partially baked. The "30-day unaffected" premium captures the true picture. When you see a premium table that shows 25% on a 1-day basis and 45% on a 30-day basis, the spread is the leak.
The economic substance: the premium is paid for control. The buyer isn't just paying for the cash flows — they're paying for the right to direct them. Force synergies. Change strategy. Push management out. Exit on their timeline. That control right has economic value beyond the standalone market price, and the premium is roughly the value of that right.
The 20–35% Range — Where It Comes From
Historical M&A data across normal market conditions shows roughly 20–35% as the typical control premium for US public-to-public deals. The number is an average across thousands of transactions over decades. Like any average, it hides enormous variance.
What sets the floor:
Shareholders need a meaningful premium to vote yes. A 5–10% premium typically doesn't clear shareholder approval in cash deals because shareholders compare the cash offer to the option value of holding the stock for future upside. There's an implicit minimum below which the deal dies in the proxy vote — boards know this, sellers know this, and the floor of the typical range is set by it.
What sets the ceiling:
At very high premiums, the buyer is paying significantly above standalone intrinsic value, which requires either large synergies or unique strategic value to justify. The acquirer's own shareholders push back. Boards face increasing fiduciary scrutiny. ISS and Glass Lewis pay attention to acquirer voting if the deal requires acquirer approval. Sell-side analysts who cover the acquirer write skeptical notes. The ceiling isn't a hard cap, but the resistance increases as the premium climbs above sector norms.
The 20–35% range is where the equilibrium typically lands for ordinary deals. The interesting question is always why a specific deal is outside the range.
When Premiums Run Higher
Six conditions push premiums above 35%.
Sole bidder, no auction. Counterintuitive but real. Competitive auctions drive premiums down to the second-highest bidder's reservation price plus a margin. When the seller has limited or no alternatives, the buyer pays closer to standalone intrinsic value, but the resulting premium against the unaffected market price can be high because the unaffected price was below intrinsic value to begin with. Microsoft/Activision at 45% had no competing strategic bidder. Sony, the obvious counter-bidder, couldn't credibly clear the antitrust hurdles and lacked the cash. The 45% premium reflected Microsoft's strategic valuation, not auction dynamics.
Strategic uniqueness. When the target asset is irreplaceable for the buyer, premiums run high. BMS/Celgene at 54%: Celgene's late-stage pipeline was specifically valuable to BMS in a way it wasn't to anyone else. The synergies BMS could extract from the Celgene portfolio were unique to BMS's existing infrastructure. Generic pharma buyers couldn't have matched the synergy value, which meant BMS was paying for a strategic fit no one else could match.
Distressed target. When the target's stock has been depressed on company-specific issues (not sector decline), the premium against the depressed price looks high while the absolute purchase price is moderate. Activision was down roughly 30% from its all-time high when Microsoft announced — the 45% premium against the depressed price would translate to a smaller premium against the historical high. Premium percentages are sensitive to the denominator, and a beaten-down stock inflates the percentage without the absolute price being aggressive.
Competitive auction among strategics. When multiple strategic buyers compete, each willing to pay for unique synergies, premiums can run extremely high. Take-Two/Zynga at roughly 64% reflected competitive dynamics in mobile gaming consolidation, with Take-Two needing the mobile platform to defend its franchise model and other potential buyers (including some of the public mobile-first studios) circling. The presence of multiple credible bidders pushes the clearing price toward the highest bidder's full reservation price.
Industry consolidation moments. When a sector is consolidating and the remaining independent targets are scarce, scarcity premium drives the number up. The buyers know that this asset, at this moment, is one of a small number of remaining options — and the seller knows it too. Recent examples in midstream energy, regional banking, and specialty insurance have shown this dynamic.
High target growth. Fast-growing targets command higher premiums because buyers are paying for the trajectory, not just current earnings. SaaS deals with 30%+ growth routinely clear 40% premiums because the strategic value compounds over the hold period. The buyer is buying years of expected growth, not snapshot earnings.
When Premiums Run Lower
Six conditions compress premiums below 20%.
Sponsor-only auction. Financial sponsors discipline each other on price. When the buyer universe is PE firms competing on IRR thresholds rather than strategic synergies, premiums stay tight to the auction-clearing return. Sponsors have a structural limit on how much they can pay (IRR targets in the 20–25% range cap the entry multiple), and competition between sponsors operates within that ceiling. Strategic auctions don't have that structural ceiling, which is why strategic-vs-sponsor competitions almost always result in the strategic winning.
Stock deals versus cash. Headline stock deal premiums tend to be lower because the value depends on post-announcement share price. The acquirer's stock typically falls on announcement (equity issuance dilutes existing holders) and sophisticated sellers price this in. The result: stock deals show lower headline premiums than cash deals on average, even when the implied economic value is similar.
Tender offers. Hostile or semi-hostile tenders sometimes price at lower opening premiums because the bidder is gambling on running the bid up if competing offers emerge or if the board capitulates. The first-bid premium is a starting position, not the final price. Friendly board-approved deals price at the final premium at announcement; tenders are negotiation openers.
Cyclical or declining business. Targets in declining industries command lower premiums because strategic value is questionable and synergy realization is harder to underwrite. Buyers pay less because the cash flow stream they're buying is structurally weaker and the synergies require restructuring the target's business rather than expanding it.
Distressed seller, tight timeline. When the seller needs to close quickly (covenant breach approaching, liquidity squeeze, regulatory pressure), they can't extract a high premium. The buyer has timing leverage. The premium reflects the urgency discount rather than the underlying value.
Management rollover deals. When management is rolling significant equity into the post-close entity, the implied premium is often lower because the rollover creates alignment with the buyer on the going-forward value rather than the day-one transfer. Management is signaling that they believe the post-close entity will be worth more than the cash offer would suggest, and accepting a lower headline premium is consistent with that belief.
Stock vs Cash Premiums
Cash and stock deals price differently. The headline premium can mislead if you don't unpack it.
Cash premiums are clean. The seller gets X dollars per share. X is unambiguous. The premium = X divided by the unaffected price. No interpretation required.
Stock premiums are noisier:
- The exchange ratio is fixed at signing in most deals
- The acquirer's stock typically falls on announcement
- The actual value the seller receives depends on the acquirer's price at close, which is unknown at signing
- Some deals have collar mechanisms that adjust the exchange ratio if the acquirer's stock moves outside a band, partially insulating the seller from acquirer price movement
Worked example. Acquirer trades at $100 per share and offers 1.4 shares for each target share, which trades at $100 unaffected. Headline premium: ($140 − $100) / $100 = 40%. On announcement, the acquirer's stock falls 5% to $95. The effective value to the seller is now 1.4 × $95 = $133, or 33% premium against the target's unaffected price. The 7-point gap between headline and effective is the typical pattern, and sophisticated sellers price in the expected acquirer drop when they negotiate the exchange ratio.
This is part of why mixed cash-and-stock deals are common: they protect the seller against some of the acquirer-price risk while still letting the buyer use stock as a partial currency. Pure stock deals have higher value uncertainty for the seller; pure cash deals are clean but require the buyer to fund the entire purchase from cash or new debt.
Premium Analysis in Practice — The Comparison
When you're analyzing a premium in an interview, the question isn't "is it normal." It's "is it justified given the precedents."
The standard premium analysis output is a precedent table comparing the target deal against recent transactions in the same sector with similar structure:
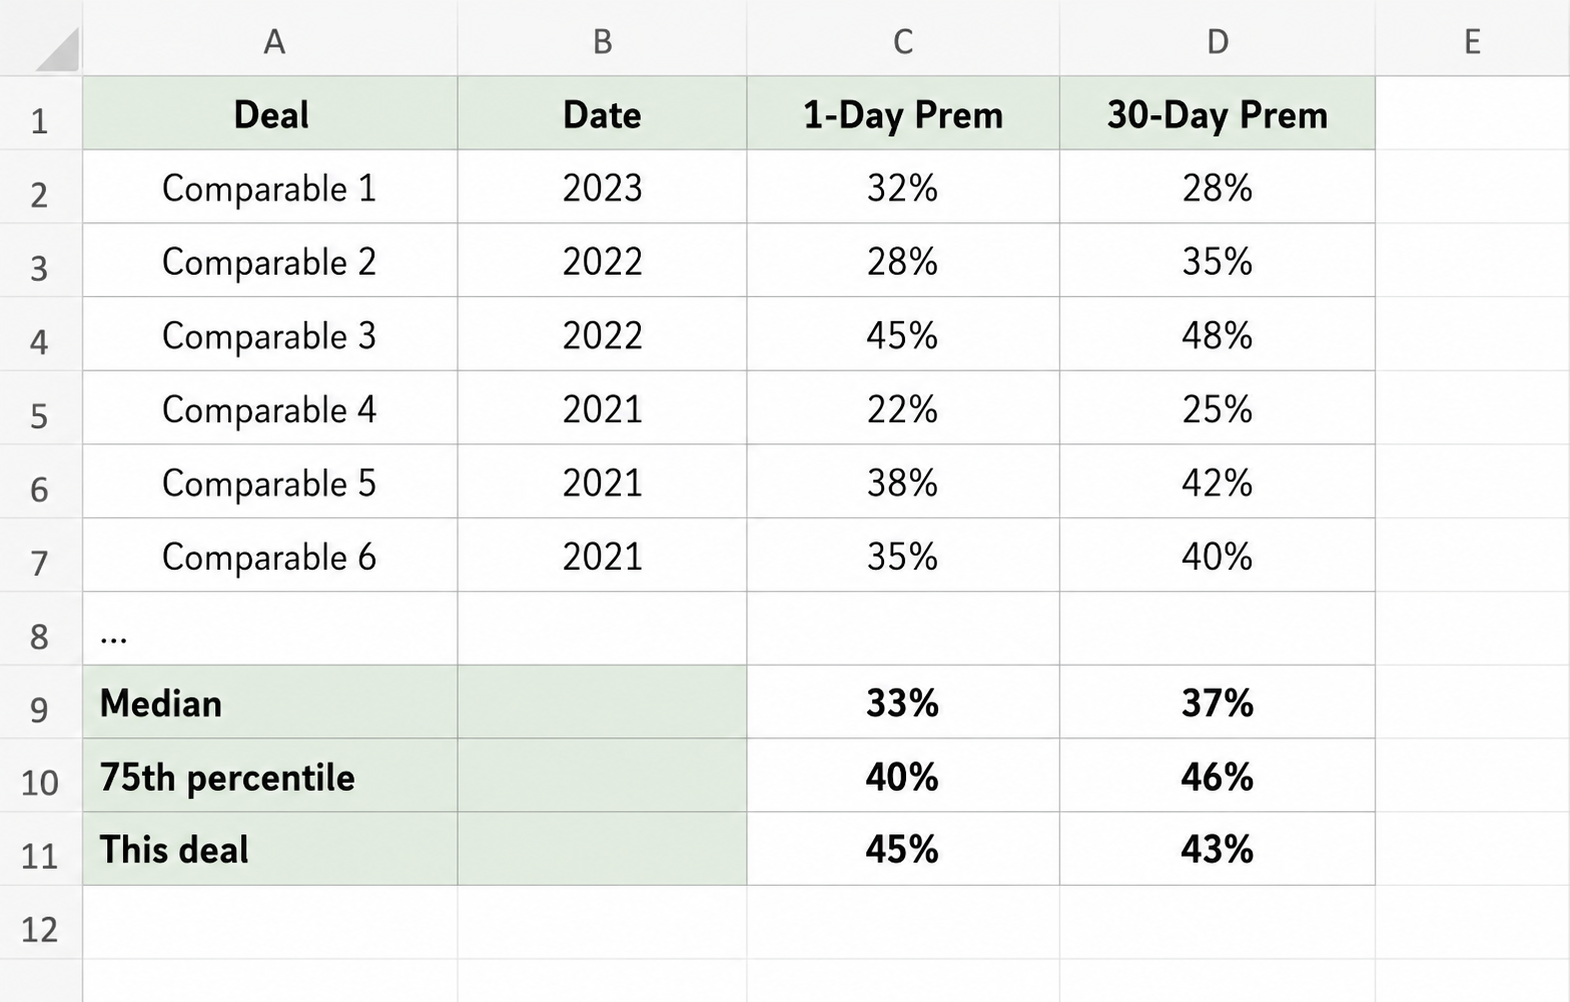
The target deal's premium gets evaluated relative to the precedent set. Above median means premium for some reason. Below median means discount for some reason. The senior question that always follows is specific: why is this deal above the precedent median, and is the reason defensible?
The answer has to name a specific factor. "Strategic uniqueness because the target's pipeline maps to our existing infrastructure." "Sole bidder dynamic because Sony couldn't credibly counter-bid." "Scarcity premium because three of the four obvious targets in this sector have already been acquired." Generic answers about "market conditions" or "competitive dynamics" don't survive a follow-up.
Selecting the precedent set is itself a judgment call. The set should match on sector, size, structure (cash vs stock vs mixed), and ideally market conditions. A 2021 precedent during a deal-market peak isn't directly comparable to a 2023 precedent during the regulatory chill. Most banker premium analyses adjust for time period and explicitly note when the set spans different market regimes.
Premium vs Synergies — The Strategic Layer
The contrarian point that earns associate-level credit.
Premiums are determined more by the bidding dynamic than by the synergy math.
In an efficient auction, the highest bidder pays a premium equal to what the second-highest bidder was willing to pay plus a small margin. The winning bidder's reservation price — their full synergy PV plus any strategic premium — is the ceiling, not the price. The actual clearing price is set by the runner-up.
The implication: buyers paying near full synergy PV are leaving little value creation on the table. Buyers paying 30–40% of synergy PV (the typical pattern in normal markets) are capturing 60–70% of synergy value as buyer-side value creation. The split between buyer and seller depends almost entirely on how contested the auction was.
This is why sole-bidder situations like Microsoft/Activision can support high absolute premiums (45%) while still being good deals for the buyer. The synergies were large enough that paying 45% still left meaningful value on the buyer side, and there was no second bidder to push the price higher. Auction-driven deals at the same headline premium would be worse for the buyer because the price was bid up closer to the synergy ceiling.
Conversely, deals at moderate premiums (25–30%) that came out of competitive auctions often look like better deals on paper but capture less of the synergy value because the auction did the work of transferring synergies to the seller. The premium percentage tells you what the deal cost; the bidding context tells you whether it was a good deal.
The trap candidates fall into: assuming premium equals share of synergies. The reality is that premium equals auction clearing price, which is set by the bidding structure as much as by the underlying economics. Two deals with identical synergy profiles and identical 30% premiums can have wildly different value creation for the buyer depending on whether the deal was sole-sourced or competed.
What MDs Push On
Concrete pressure points and the right responses.
"Why is this premium reasonable?" Compare to precedents. Identify the driver of any variance from the median. Don't say "it's in the range" if it isn't. Don't say "the strategic logic justifies it" without naming the specific strategic factor.
"What would change the premium?" Identify the relevant inputs: emergence of a competing bidder, shift in target growth profile, change in sector consolidation dynamics, change in credit market conditions affecting sponsor competition. The interviewer wants to see you can run the sensitivity.
"Is the premium for control or for synergies?" Distinguish. The control premium is the value of being able to direct cash flows independent of synergy realization, typically 10–15% of unaffected market value in baseline transactions. The synergy share is the portion of expected synergy PV that ends up with the seller. Buyers typically pay 30–50% of synergy PV away in the premium, depending on auction dynamics. The headline premium is the sum.
"What's the implied EV multiple at this premium?" Force you to back into the multiple. If the unaffected price implies 12x EBITDA and the premium pushes to 17x, the multiple comparison against precedents is more relevant than the premium percentage. Senior bankers care more about multiple paid than premium paid because the multiple is a cleaner comparison against precedent transactions and trading comps.
"Would you do this deal at a 50% premium?" Tests the marginal premium dollar against synergy PV. Past a certain point, the deal becomes value-destroying for buyer shareholders regardless of strategic logic. The honest answer requires running the math: at 50% premium on the same target, what's the implied multiple, what's the implied synergy capture, and does the deal still create value for the acquirer's shareholders?
The 90-Second Walkthrough
A compressed walkthrough that demonstrates premium analysis structure:
"The premium is offer price minus unaffected price, over unaffected price. Convention is 1-day unaffected, but 30-day is the cleaner number because it washes out leak. Typical control premiums for US public-to-public deals run 20–35% in normal market conditions.
The premium gets evaluated against a precedent set: recent deals in the same sector, similar structure, similar market environment. Above-median premiums need a specific justification: strategic uniqueness, sole-bidder dynamics, scarcity in the sector, or a fast-growing target where you're paying for trajectory.
Cash and stock deals don't price the same. Headline stock-deal premiums understate the effective premium because the acquirer's stock typically falls on announcement, reducing the actual value the seller receives by the close.
The strategic layer most candidates miss: premiums are set by the bidding dynamic, not the synergy math. In a sole-bidder situation, even a 45% premium can leave most of the synergy value with the buyer. In a contested auction, a 25% premium can transfer most of the synergy value to the seller. The premium percentage tells you what the deal cost — the bidding structure tells you whether it was a good deal."
About 95 seconds at a measured pace. Hits the calculation, the precedent comparison, the structural distinction between cash and stock, and the strategic layer on auction dynamics. That's the version that sounds like someone who's actually worked on a sell-side process.
Where to Drill
The Analyst-level interviewer on HARDO pushes on the math: calculation, precedent comparison, sensitivity to changes in inputs. The Associate-level interviewer pushes on the strategic layer: why this premium specifically, what would change it, how much of the synergy PV transferred to the seller. Premium analysis is one of those topics where the textbook answer is necessary and insufficient. The reps are how you build the muscle to defend a specific premium against a specific MD's pushback.
Reading is reps. Now take the rep.
Drill this in a mock- Knowledge HubHow to Answer Due Diligence Questions in an Investment Banking Interview
Due diligence is the IB interview category with no formula. What QoE reports actually check, the working capital peg, and how to prioritize red flags.
- Knowledge HubHow to Handle an IB Interview Question You Didn't Prep For
Investment banking interviews always include a question you didn't prep for. How to handle the miss without bluffing, freezing, or surrendering.
- Knowledge HubFirst-Round vs Superday: What Actually Changes
First-round and superday are not the same interview at harder difficulty. What actually changes between them, and how to prep for each