LBO Mechanics — From Sources & Uses to IRR Bridge
The full LBO walkthrough — sources and uses, debt schedule, cash sweep, IRR bridge. Where the return actually comes from, and what MDs push on.

LBO questions are the single best stress test in IB interviews because there's nowhere to hide. Every input has to tie. Every output has to make sense. If your sources don't equal your uses, your model is broken before you start. If your IRR is 8% on a buyout, you've done something wrong and an associate will spot it in under thirty seconds.
The mechanics aren't actually hard once you've built one. The difficulty is that most candidates have memorized the structure without ever forcing the numbers to balance, which means they fall apart the moment an interviewer changes a single input. Drop the entry multiple by a turn and the candidate who memorized the steps freezes. The candidate who built the model recalculates in their head.
This piece walks the full LBO start to finish: sources and uses, debt schedule, returns, and the IRR bridge that decomposes where the return actually came from. The IRR bridge is the part most candidates have never seen, and it's also the part that separates Analyst from Associate-level conversations.
What an LBO Is, Mechanically
Strip away the romance. An LBO is a financial sponsor (a private equity firm) buying a company using mostly borrowed money, holding it three to seven years, and selling it for more than they paid. The sponsor's equity check is small relative to the enterprise value, typically 30–40% of EV at deal close. The rest is debt, and the debt sits on the acquired company's balance sheet, not the sponsor's. The company pays the debt down using its own cash flow during the hold period.
The return to the sponsor comes from three sources, and these three sources are the entire point of the IRR bridge:
- EBITDA growth during the hold
- Debt paydown from free cash flow generation
- Multiple expansion or contraction at exit
Get the three buckets into your head now, because everything that follows reinforces them.
The reason LBOs work as a strategy is financial engineering. If you buy a company for 10x EBITDA with 60% debt financing, you've put up the equivalent of 4x EBITDA in equity. If you sell at 10x EBITDA five years later and EBITDA has doubled, you sell for 20x your original EBITDA, pay off the remaining debt, and pocket the rest. The math is leveraged equity returns. The same operational improvement that produces a 50% return on an all-equity investment produces a 200%+ return when most of the capital came from lenders. That's the entire game.
Step 1: Sources & Uses
The discipline starts here. Every dollar going into the deal (sources) must equal every dollar going out (uses). If they don't tie, you have an arithmetic error, not a model.
Sponsor equity is the PE firm's own check, typically 30–40% of total funding. Revolver is a senior secured credit facility, usually drawn at zero at close; it sits available for working capital needs across the hold. Term Loan B is the workhorse of LBO financing: senior secured, floating rate, light mandatory amortization (typically 1% per year with a bullet at maturity). Senior Notes are unsecured, fixed rate, bullet maturity, more expensive than Term Loan B because they sit junior to the secured debt. Subordinated Notes or Mezzanine sit even deeper in the capital structure with higher coupons. Management rollover equity is the portion of existing management's stake that rolls forward into the new entity rather than getting cashed out, which aligns management with the sponsor.
Purchase equity value is the offer price times diluted shares outstanding. Refinancing existing debt happens because acquired companies almost always have debt that gets paid off at close and replaced with new financing structured around the LBO. Transaction fees cover advisory, legal, and accounting, typically 2–3% of EV. Financing fees cover lender fees and original issue discount on the new debt, typically 1–2% of debt raised. Minimum cash to balance sheet is a working capital cushion to ensure the company has liquidity from day one.
The mechanic in practice: start with purchase equity value, layer in debt refinancing and fees to arrive at total uses, then back into sponsor equity by solving for the gap between total uses and the debt the credit market will provide.
A sample S&U: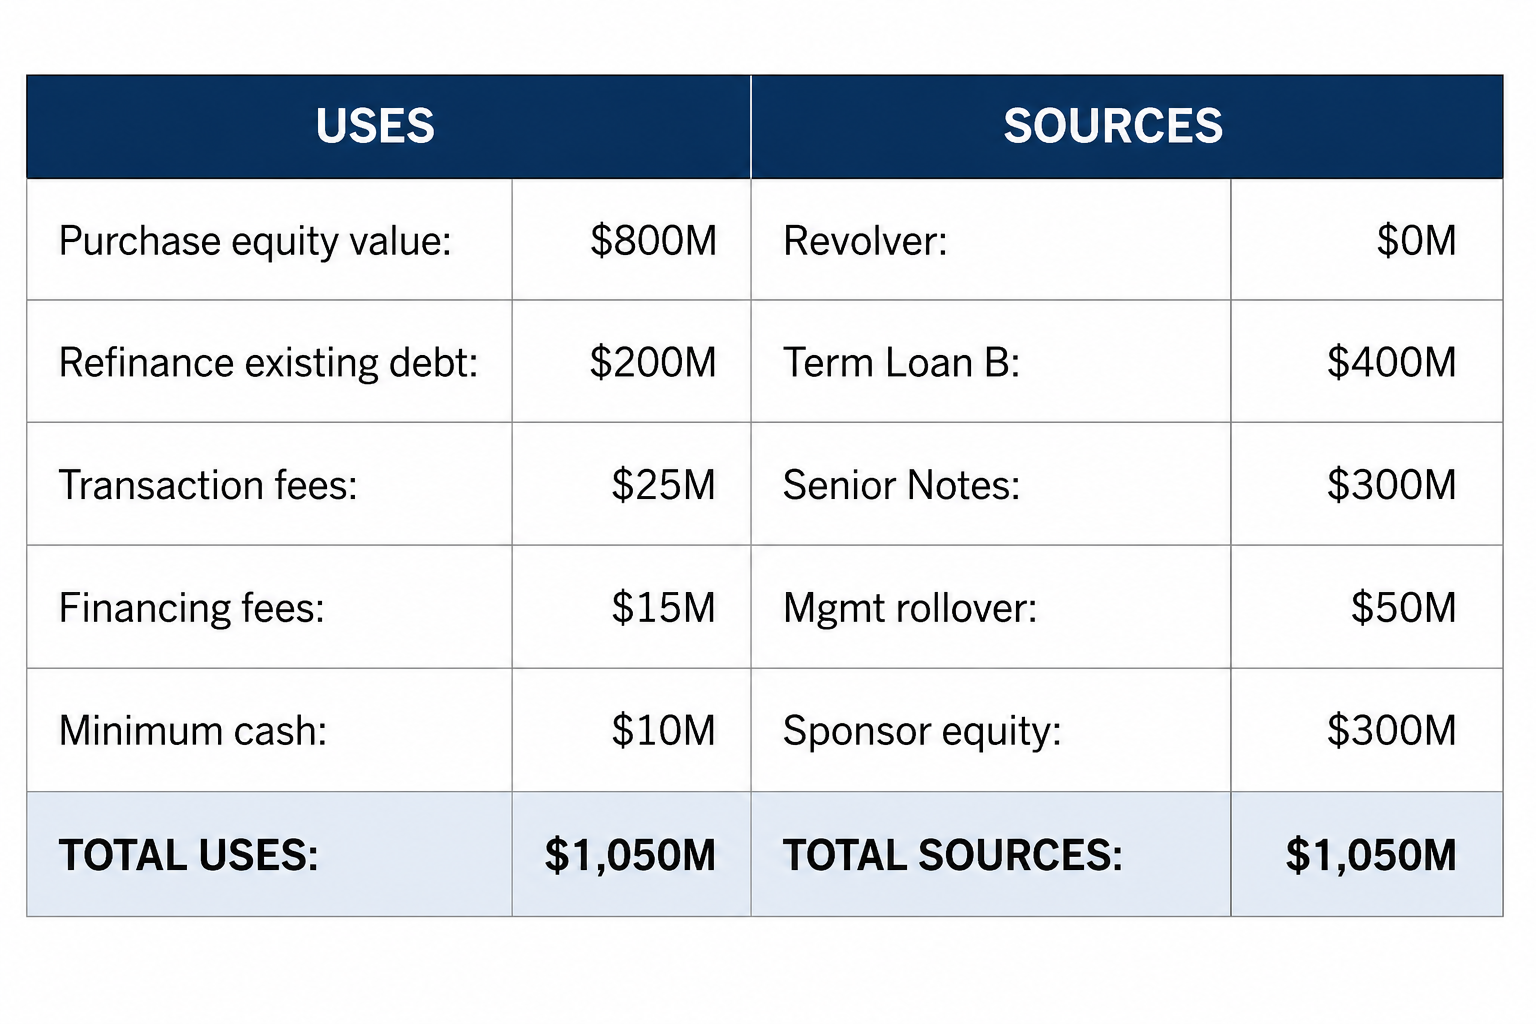
If an interviewer changes one input — "what if transaction fees are $50M instead of $25M?" — you should be able to flow it through immediately. Total uses goes up $25M. Sponsor equity goes up $25M to fill the gap, assuming the debt capacity is fixed. Sponsor equity is the plug.
Step 2: Entry Valuation
Quick but important. Purchase enterprise value versus purchase equity value:Purchase EV = Purchase Equity Value + Debt − Cash
Or, equivalently, off EBITDA:Purchase EV = LTM EBITDA × Entry Multiple
The entry multiple sets the bar for everything that follows. A 12x entry is much harder to make work than an 8x entry, because at exit you're either depending on multiple expansion — which is rare and not under sponsor control — or you need EBITDA growth and debt paydown to do all the lifting. Sponsors paying high entry multiples are betting on operational levers they can actually pull, or they're in a competitive auction and overpaying because the market made them.
The standard sanity check after you've built the entry: what's the implied debt-to-EBITDA at close? Sponsors typically lever 5–7x EBITDA at close, depending on the credit market and the stability of the business. If your model has 9x leverage, either the credit market is unusually hot, the business has exceptionally stable cash flows that lenders will support, or you've made a mistake. Subscription software businesses get higher leverage than cyclical industrials. Recession-resistant healthcare services get higher leverage than discretionary consumer. Know which bucket you're in.
Step 3: Debt Schedule and Cash Sweep
This is where most candidates lose the thread. The debt schedule tracks each tranche of debt across the hold period: beginning balance, mandatory amortization, optional prepayment via cash sweep, ending balance. It runs year by year for every year of the hold.
The hierarchy of cash flows in any given year:
EBITDA− Cash taxes− Cash interest− Mandatory debt amortization− CapEx− Change in working capital= Free cash flow available for optional debt paydown (cash sweep)
That residual FCF gets swept toward the most senior tranche first (Term Loan B), then the next, and so on down the capital structure. In a healthy LBO, the company is generating enough FCF to meaningfully delever during the hold, which is what creates the debt paydown contribution to equity returns.
The interest expense calculation introduces a circularity that trips up candidates who haven't worked through it in a model:
Interest = Average debt balance × interest rateAverage debt balance = (Beginning + Ending) / 2Ending debt depends on cash sweepCash sweep depends on FCFFCF depends on interest expense
In Excel you handle this with iterative calculation enabled — the model loops until it converges. In an interview you handle it by acknowledging the circularity exists and saying you'd use average balances. Don't pretend it isn't there. Interviewers know it is and the acknowledgment signals you've actually built one.
The mandatory amortization mechanics worth knowing. Term Loan B typically amortizes at 1% per year with a bullet for the remaining balance at maturity (usually 7 years). Senior Notes are usually bullet maturity with no scheduled amortization (usually 8 years). Revolver is undrawn at close and gets drawn for working capital needs across the hold. The cash sweep on TLB is typically 50–75% of excess cash flow, stepping down as leverage decreases: at lower leverage, the sweep percentage drops, giving the company more flexibility.
The thing to flag in any LBO walkthrough: in a healthy deal, the company should be deleveraging meaningfully across the hold. Entry leverage of 6x going to 3–4x at exit is the standard arc. If your model shows the company at the same leverage at exit as at entry, either FCF is too weak to service the deal — in which case the credit market shouldn't have funded it — or you've made an error in the cash sweep. Sponsors don't underwrite deals where the debt doesn't come down.
Step 4: Exit Valuation
Exit EV is calculated the same way as entry EV, with the exit multiple usually assumed equal to entry multiple as the base case:
Exit EV = Exit Year EBITDA × Exit MultipleExit Equity = Exit EV − Net Debt at Exit
The default assumption (exit multiple equals entry multiple) is conservative on purpose. It forces the return to come from EBITDA growth and debt paydown rather than from multiple expansion. Multiple expansion is the assumption sponsors can't control: it depends on the credit market, the equity market, and the M&A environment at the moment of exit. If your IRR depends on multiple expansion, you're hoping the market is more generous in five years than today. That's not a strategy. That's a wish.
Sensitivity on exit multiple is where every PE investment committee starts the conversation. The base case assumes flat multiples. The downside case assumes 1–2 turns of compression. If the downside case still produces a 12%+ IRR, the deal has margin of safety. If a single turn of compression knocks IRR below 10%, the deal is structurally fragile and ICs will push back hard.
Step 5: Returns
Two numbers matter. IRR and MOIC.
MOIC = Exit Equity / Initial Sponsor EquityIRR ≈ (MOIC)^(1/Hold Period) − 1 [simplified, no interim distributions]
The working sponsor return hurdles to know cold:
A 20%+ IRR is the target for traditional buyouts. This is what funds market to their LPs when they raise the next vintage. A 2.0–3.0x MOIC over 5 years corresponds roughly to a 15–25% IRR range. Below 15% IRR, the deal probably gets killed at IC unless there's strategic logic: a platform play that sets up future M&A, a captive financing channel, something that doesn't show up in the base-case IRR. Above 30% IRR is usually too good to be true and worth a second look: either your assumptions are aggressive or you've missed a risk.
The math relationship between IRR and MOIC is worth memorizing. 2x in 4 years is roughly 19% IRR. 2x in 5 years is roughly 15%. 3x in 5 years is roughly 25%. 3x in 4 years is roughly 32%. Interviewers will quiz this without warning — "if I told you the deal returned 2.5x over 5 years, what's the IRR?" — and "around 20%" is the answer they want, not silence while you reach for a calculator.
The IRR Bridge — Where the Return Actually Came From
This is the part most candidates have never seen, and it's also the part Associate interviewers care about most. The IRR bridge decomposes total equity return into the three drivers.
EBITDA growth contribution. How much did the company's EBITDA grow during the hold, and what's that growth worth at the entry multiple? If EBITDA went from $100M to $150M and the entry multiple was 10x, the EBITDA growth created $500M of enterprise value, all of which flows to equity because the debt didn't grow.
Debt paydown contribution. How much debt did the company pay down using its own cash flow? Each dollar of debt retired is a dollar that flows to equity at exit instead of to lenders. If the company paid down $300M of debt during the hold, that's $300M of value transferred from creditors to equity holders.
Multiple expansion or contraction. Did the exit multiple differ from the entry multiple? The delta times exit-year EBITDA is the value created (or destroyed) by the change in market sentiment.
A worked example. Buy for $1B EV at 10x $100M EBITDA. Capital structure: 60% debt ($600M), $400M equity check. Hold 5 years. Exit at 10x on $150M EBITDA = $1.5B EV. Debt paid down to $300M during the hold. Exit equity = $1.5B − $300M = $1.2B. MOIC = 3.0x. IRR roughly 25%.
The decomposition:
EBITDA growth: $50M × 10x = $500M of value createdDebt paydown: $300M of debt retired = $300M to equityMultiple expansion: 0 turns × $150M = $0
Equity value walk:Original equity check: $400M+ EBITDA growth contribution: $500M+ Debt paydown contribution: $300M+ Multiple contribution: $0= Exit equity: $1,200M
Ties. Total value to equity is $1.2B against an initial $400M check, a 3.0x MOIC.
The lesson for interview purposes: when an interviewer asks "where did the return come from," you should be able to answer in those three buckets, in order of contribution. And when they push — "what if EBITDA only grew 20% instead of 50%?" — you should be able to recalculate the bridge in your head. EBITDA at exit becomes $120M instead of $150M. Exit EV becomes $1.2B at 10x. Exit equity becomes $1.2B − $300M debt = $900M. MOIC drops from 3.0x to 2.25x. IRR drops from 25% to roughly 18%. The bridge is additive, which is what makes it the most useful framework in the whole model.
What Interviewers Push On
Concrete pressure points, with the right responses.
"Walk me through the impact of a 1-turn multiple contraction at exit."
"What if interest rates rise 200 bps during the hold?"
"Why is the equity check 40% rather than 30%?"
"What's a dividend recap and how does it change returns?"
"How does management rollover affect sponsor returns?"
The 90-Second Walkthrough
A sample compressed walkthrough that hits the structure without getting lost in the mechanics:
"An LBO is a sponsor buying a company with mostly debt, holding three to seven years, and selling for a return on the equity check. Sources and uses have to tie: sponsor equity, typically 30–40% of EV, fills the gap after debt and other sources. Entry valuation is usually quoted as a multiple of LTM EBITDA, and leverage at close runs 5–7x depending on the business and the credit market.
Across the hold, the company services its debt: interest, mandatory amortization, and an optional cash sweep that uses excess FCF to pay down the senior tranche first. A healthy LBO delevers from entry to exit by 2–3 turns of EBITDA.
Exit valuation defaults to flat multiples (entry equals exit), which forces the return to come from EBITDA growth and debt paydown rather than multiple expansion. MOIC is exit equity over initial equity check. Target IRR is 20%+ on a traditional buyout.
The IRR bridge decomposes return into three drivers: EBITDA growth at entry multiple, debt paydown from FCF, and any multiple expansion. The base case usually has the first two doing most of the work, because multiple expansion isn't under sponsor control. I'd run sensitivity on entry multiple, exit multiple, and EBITDA growth, since those three variables drive most of the variance in the answer."
Roughly 110 seconds spoken at a measured pace. Hits the structure, names the three return drivers, signals the sensitivity discipline, and avoids the trap of trying to recite every line of a model.
Where to Drill
The Analyst-level interviewer on HARDO is built for the kind of numerical edge cases LBO questions live in: "what if leverage was a turn higher," "what if cash sweep was 100% instead of 75%," "what's the IRR if EBITDA only grew at GDP." Associate-level pushback runs harder on the IRR bridge and the defend-your-return mechanics — the questions where false confidence collapses fastest. If LBO mechanics are the part of your prep stack that still feels brittle, that's the seat to take.
Reading is reps. Now take the rep.
Drill this in a mock- Knowledge HubHow to Answer Due Diligence Questions in an Investment Banking Interview
Due diligence is the IB interview category with no formula. What QoE reports actually check, the working capital peg, and how to prioritize red flags.
- Knowledge HubHow to Handle an IB Interview Question You Didn't Prep For
Investment banking interviews always include a question you didn't prep for. How to handle the miss without bluffing, freezing, or surrendering.
- Knowledge HubFirst-Round vs Superday: What Actually Changes
First-round and superday are not the same interview at harder difficulty. What actually changes between them, and how to prep for each