Comparable Companies — Pick, Adjust, Defend
Trading comps under VP pressure. How to pick the set, what to adjust, which multiples to use, and how to defend every name on the list.
Trading comps is one of the most underrated interview questions because candidates assume it's simple.
Find similar companies. Pull their multiples. Apply to target. Done.
That's the floor. The senior version is whether you can defend every name in the set, every adjustment to EBITDA, every choice of multiple, and where the target should sit relative to the range. A VP doesn't care that you know how to pull a comp screen from Capital IQ. That's the analyst's job, and a good one will do it in twenty minutes. The VP cares whether you understand why each comp belongs in the set, what its inclusion does to the valuation, and whether the range you're producing is tight enough to mean anything.
The work is in the judgment, not the spreadsheet. This piece walks the three layers — picking the set, adjusting the numbers, defending the conclusion — at the level a senior banker is actually testing.
Why Comps Exist (And What They're Not)
Strategic frame first, because most candidates don't internalize the limits of what comps actually do.
Comps are a relative valuation technique. They tell you what the market thinks similar companies are worth right now, not what they're intrinsically worth — that's a DCF's job. Comps tell you where consensus is. That's a different question, and useful for a different reason.
The reason comps are valuable: they incorporate current market sentiment that DCFs structurally miss. The public market knows things about sector multiples — risk premiums, growth expectations, capital structure preferences, sector rotation, rate environment — that no individual model can capture. When you pull comps, you're tapping into the aggregated view of every analyst, PM, and trader who looks at that sector. That's information your DCF doesn't have.
The reason comps fail: they assume the market is right. If the entire sector is overvalued, your comp set will give you an overvalued answer. The canonical example is 1999: tech traded at 50x+ forward EBITDA, and comp-based valuations of private tech companies that year supported deal prices that would look insane two years later. The market eventually disagreed with itself by 80%. Comps don't help you spot bubbles; they participate in them.
Picking the Set — The Question That Decides Everything
The single most consequential step in the entire exercise. The set determines the answer. Two analysts handed the same target can produce comp sets that differ by 30% on the median multiple — and therefore by 30% on the valuation — purely based on which companies they chose to include.
The selection criteria, in roughly the order they matter:
Business model. Same product or service, same customer base, same sales motion. A pure-play SaaS comp for a SaaS target. A specialty pharmaceutical comp for a specialty pharma target. A marketplace comp for a marketplace target. The temptation to include a company just because it's in the same broad industry ("they're both software, that's enough") is the most common failure. Software is not a comp set. Vertical SaaS for SMB customers is a comp set.
Size. Generally within roughly 0.5x to 2x your target's revenue. Microsoft is not a comp for a $500 million software business. The market discounts smaller companies (small-cap discount is real and persistent) and rewards scale through platform multiples that smaller companies can't earn. A comp set that spans $200M revenue to $200B revenue is not a comp set; it's a list of public companies.
Growth profile. A 30% revenue grower does not trade like a 10% revenue grower in the same sector. The market pays for growth, and the premium is substantial: often 5x or more on EV/Revenue between high and low growers in the same vertical. Pick comps with growth rates within a reasonable band of the target.
Geography. US-listed companies trade at different multiples than European or Asian-listed companies because of investor base, liquidity, accounting standards, and tax treatment. If your target is US, US comps. If your target is European, European comps. Cross-listed companies can muddy the picture, so be deliberate about which exchange's multiple you're using.
Margin profile. An 80% gross margin software company is not directly comparable to a 30% gross margin services company even if they sell to the same customers. The market values them differently because the operating leverage is different. Match on margins to the extent the comp set allows.
Capital structure. Affects P/E heavily and EV/EBITDA less. If your target carries 4x leverage and your comps are mostly equity-financed, P/E comparisons will be distorted by interest expense. Acknowledge the difference and lean on EV/EBITDA for the cleaner read.
The trap candidates fall into: pulling "obvious" comps that don't satisfy these criteria. The first-year instinct is to include any public company in the same broad industry. The senior question is always why this company, given the differences. Every name in the set needs a one-sentence defense.
Worked example. Valuing a $200 million revenue SaaS company growing 25% with 75% gross margins. Bad comp set: Salesforce, Oracle, Microsoft, Adobe. Each of those companies is 50x to 500x the target's revenue, trades on platform dynamics that don't apply at smaller scale, and carries enterprise customer expansion mechanics that a $200M company can't credibly claim. Good comp set: smaller pure-play SaaS at similar growth and margin profile, companies you'd have to actually research, not just pattern-match by name recognition. The good set is harder to build. That's the point.
Which Multiple, and Why
The default hierarchy of multiples for trading comps:
EV/EBITDA. Standard for most mature businesses. It's the cleanest comparison across companies with different capital structures because EBITDA is pre-interest. Use it whenever the business has meaningful, stable EBITDA.
EV/Revenue. For growth businesses where EBITDA is small, negative, or volatile. Common in early-stage SaaS, biotech, and any business pre-profitability. The implicit assumption is that the target will achieve sector-typical margins at maturity. State the assumption out loud: revenue multiples without a margin assumption are meaningless.
P/E. Standard for financial services (banks, insurance, asset management) where EBITDA isn't a meaningful metric and leverage is part of the business model rather than a financing choice. Also defensible for stable mature businesses where the capital structure is consistent across the comp set.
EV/EBIT. When comp companies have meaningfully different D&A profiles. Useful when comparing asset-heavy to asset-light businesses in adjacent sectors. EV/EBITDA can mask real capital intensity; EV/EBIT puts it back in.
Forward vs trailing. The convention is forward (next twelve months, NTM) because the market prices on future earnings, not past ones. Trailing (LTM) multiples are context, useful for showing what the market paid historically and how multiples have moved, but the primary multiple in any analysis should be forward. The exception is when the next year is unusually distorted by something specific (a known one-time event, a major capacity expansion), in which case use a normalized forward or extend to NTM+1.
Adjusting the Numbers
This is where most candidates fail. They pull the comp screen, take the reported EBITDA numbers as printed, build the table. The VP looks at the unadjusted figures and the entire analysis is suspect, because they know exactly what's hiding in those numbers.
The standard adjustments to EBITDA:
One-time items. Restructuring charges, legal settlements, gains and losses on asset sales, M&A transaction costs, impairment charges. None of these are part of the recurring earnings power of the business. Strip them out. They show up in the management's adjusted EBITDA reconciliation in the earnings release: read it.
Stock-based compensation. Contested across sectors. Standard practice in tech is to exclude SBC ("adjusted EBITDA excludes stock-based compensation"). Standard practice in industrials is to include it. The honest position: SBC is a real economic cost. It dilutes existing shareholders just as cash compensation reduces cash earnings. Excluding it overstates EBITDA and inflates the comparable multiple. The senior view is to include SBC where possible, or at minimum to be transparent about which convention you used and apply it consistently across the entire set. The VP pushback that catches candidates: "you excluded SBC for the target but included it for two of the comps. What's the adjusted figure if you do it the same way everywhere?"
Operating leases. Pre-2019, operating leases were off-balance-sheet under both GAAP and IFRS. After IFRS 16 (2019) and ASC 842 (also 2019), operating leases are capitalized: they appear on the balance sheet as right-of-use assets and corresponding liabilities, and the rental expense gets split into depreciation and interest. If you're comparing periods that straddle the adoption, adjust. For modern comp sets (post-2019), this is mostly resolved, but legacy figures need normalization.
Pension expense. For industrials and other businesses with material defined-benefit pension obligations, the GAAP pension expense includes a service cost (real, recurring) and a financial component (interest cost minus expected return on plan assets) that's more financing than operating. Normalize to the service cost.
Unusual gains and losses on FX or hedging. Strip out anything that isn't core to operations.
For enterprise value, the bridge:
Equity Value (diluted shares × share price)
+ Total Debt (market value if liquid, book if not)
− Cash and Cash Equivalents
+ Preferred Equity (face value)
+ Minority Interest / Non-Controlling Interest
+ Underfunded Pension (where material)
+ Operating Lease Liabilities (if not already in debt)
= Enterprise Value
Diluted shares means treasury stock method for in-the-money options and if-converted method for convertible debt and convertible preferred. If you can't apply both methods cleanly, you're not ready to walk through trading comps in an interview. Go back to the fundamentals.
The Output — Median, Mean, and Where Your Target Sits
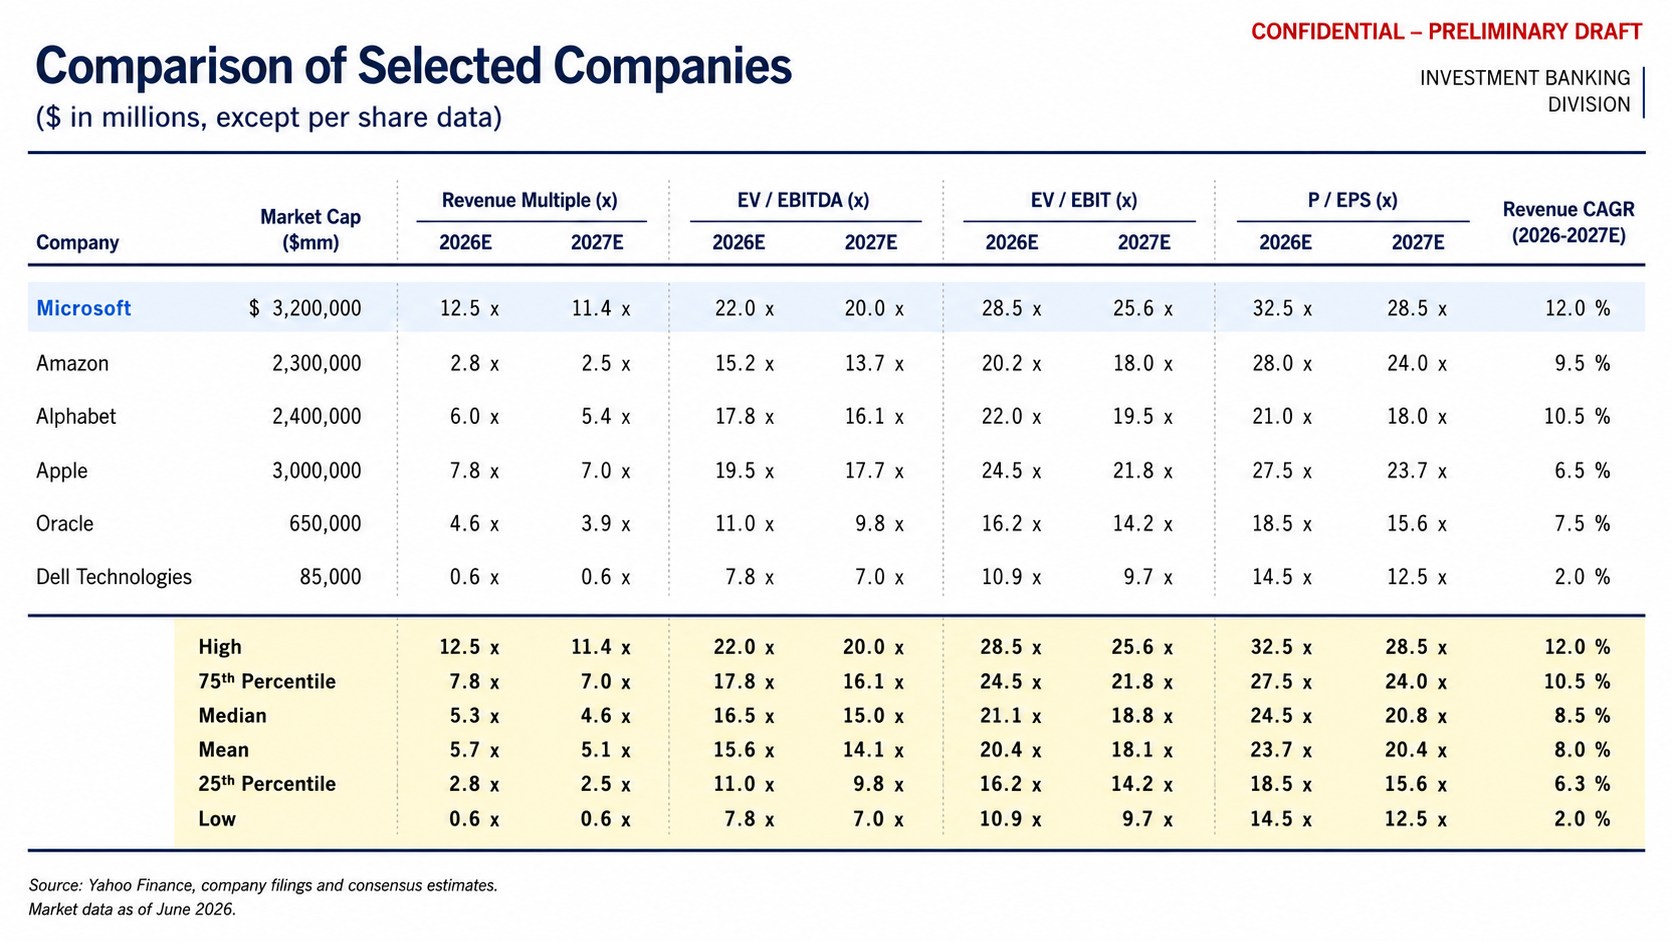
Once you have the set and the adjusted multiples, present the range. The standard outputs:
- Min, max
- 25th percentile, median, 75th percentile
- Mean (less commonly used because outliers skew it)
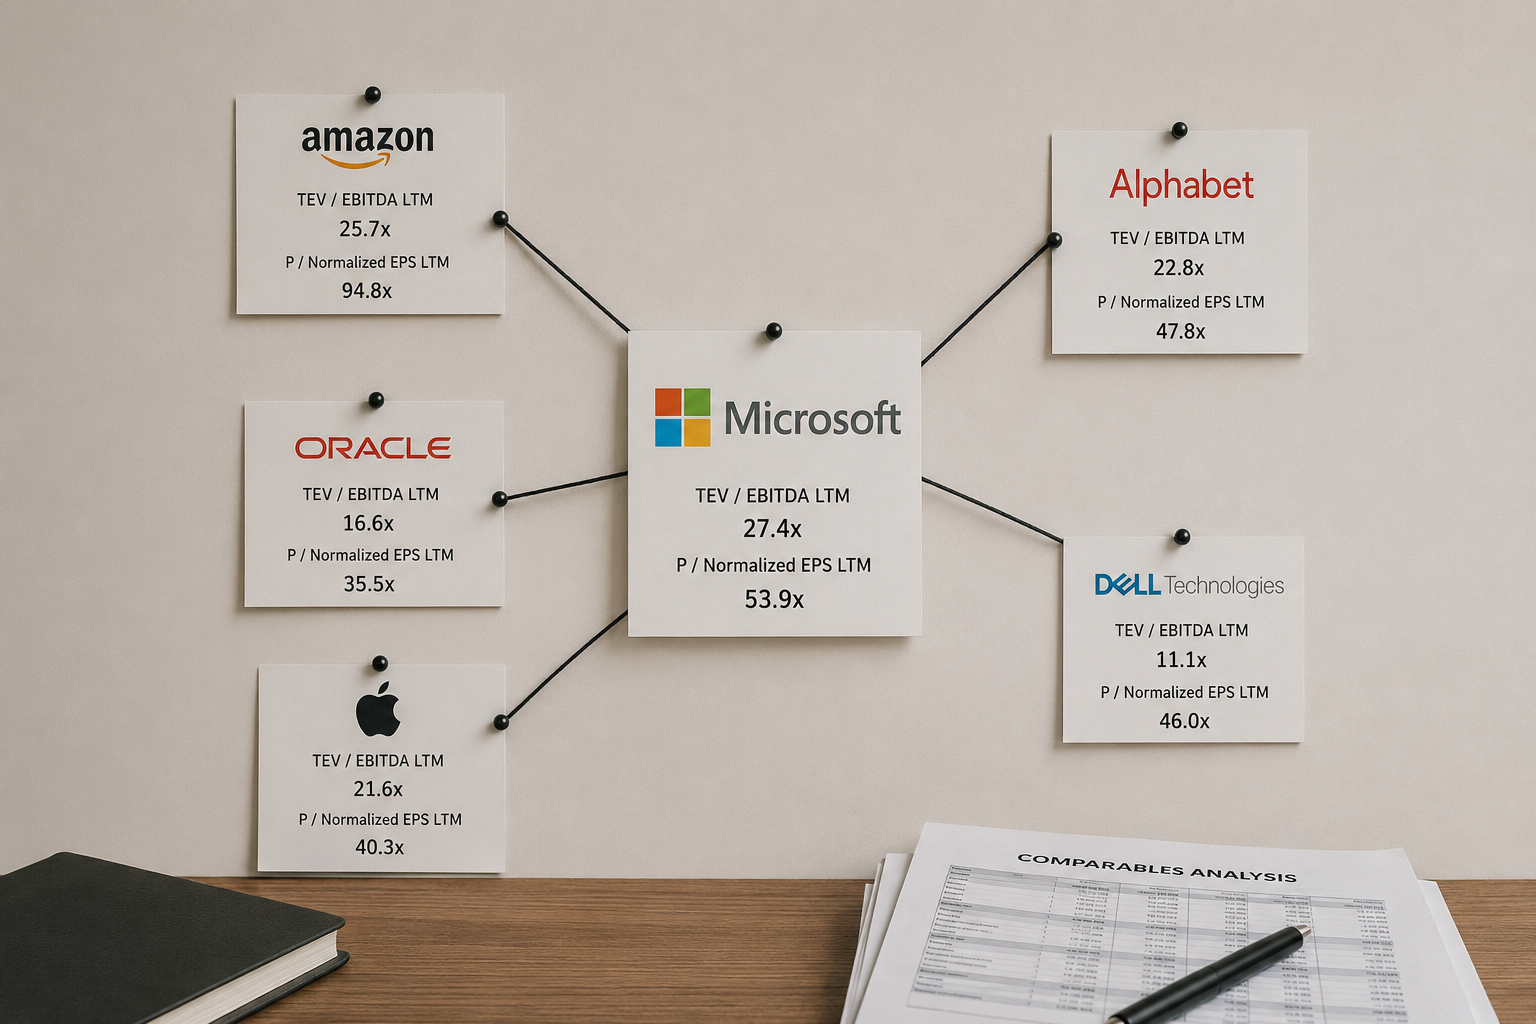
Illustrative example of the output on the slide:
Most candidates default to the median multiple as the headline answer. The senior question is why median, not the 25th percentile or the 75th?
The answer depends on where your target sits in the set on the dimensions that matter: growth, margins, scale, market position, governance.
Rough guidance for where to land:
- Target is the fastest grower in the set, by a meaningful margin → top quartile or higher
- Target is below the median on margins → bottom quartile
- Target is small relative to the set → discount for size differential
- Target is the cleanest pure-play in the set (less segment dilution) → premium to median
- Target has integration risk, dual-class voting structure, governance issues, customer concentration → discount
This is where the comp analysis becomes judgment-driven rather than mechanical. The VP isn't asking for the median multiple × the target's EBITDA. They're asking where the target should trade and why. The answer "median, because that's the middle of the set" is the cop-out answer. Pick a tier and defend it on the dimensions you can name.
Defending the Set — What VPs Push On
The pressure points, with the right responses.
"Why is [Comp X] in your set?" Have a one-sentence defense for every name. Business model match, scale match, growth profile match, geography. If you can't defend a comp in one sentence, it shouldn't be in the set.
"Why isn't [Comp Y] in your set?" Anticipate the obvious omissions. If you excluded the sector leader, have a reason ready: "Salesforce is roughly 100x the target's revenue and trades on enterprise platform dynamics that aren't relevant at this scale — different bucket." The absence has to be defensible too.
"Your range is 8x to 20x. Why so wide?" A wide range is the VP's signal that the set isn't actually a tight comp group. Either explain the dispersion structurally — "the top of the range is the fastest grower in the set at 35%; the bottom is a low-growth incumbent at 4%" — or tighten the set. Don't pretend a 2.5x dispersion in multiples is a clean comp set.
"Where does the target sit?" This forces you to pick a tier from the range. As discussed, the median default is weak. Have a specific position and defend it on the relevant metrics.
"What's the comp set telling you that your DCF isn't?" The triangulation question. If comps say $50 per share and DCF says $75, which is closer to right? The senior answer is usually that they're capturing different things: comps reflect current market sentiment which may be temporarily depressed or elevated, while DCF reflects your forecast which may be optimistic or conservative. The right answer is a triangulated range, not picking one method.
"What would change your view?" Tests whether you've thought about the limits of the analysis. The honest answer: sector multiples can contract or expand 20–30% in six months on rate moves, sector rotation, or sentiment shifts. The comp set you're using today might be the wrong number in any other environment. Acknowledge this. Senior bankers respect calibrated uncertainty more than false confidence.
The Triangulation — How Comps Fit With Other Methods
Senior bankers don't trust any single valuation method. The standard triangulation in a real valuation discussion:
- Trading comps: what the public market currently thinks similar companies are worth
- Precedent transactions: what acquirers actually paid in past M&A, including the control premium
- DCF: intrinsic value from your own forecast and discount rate
- 52-week trading range: for public targets, what the market has actually paid recently
- Premium analysis: for M&A specifically, what premiums similar deals have shown over unaffected trading prices
The art of valuation is in the convergence. When all four or five methods point to overlapping ranges, the valuation is well-supported and the price discussion becomes a question of where within the range to land. When the methods diverge widely, the analyst's job is to explain why — usually one method is capturing something the others aren't, and the explanation is itself part of the analysis.
Standard convergence patterns to know:
- DCF higher than trading comps: either the public market is undervaluing the sector, or your cash flow forecast is more optimistic than the market's view. Useful diagnostic.
- Trading comps higher than DCF: opposite case. Either the market is overvaluing the sector or your DCF is conservative on growth or margins.
- Precedents higher than trading comps: the normal pattern, reflecting the control premium acquirers pay. Typical control premiums in US M&A are 20–35% over unaffected trading price.
- Trading comps higher than precedents: unusual. Suggests recent multiple expansion or that the precedent deals were unusually cheap. Worth investigating.
The triangulated range is the answer. The point estimate from any single method is not.
The 90-Second Walkthrough
"Trading comps are a relative valuation technique. You build a set of public companies that match your target on business model, scale, growth, and geography, pull their multiples, adjust EBITDA consistently for one-time items and stock-based comp, and compare to your target.
The set is the most important step. I'd target six to ten companies in the same business model and broadly similar size. For a $200 million SaaS company growing 25%, that means pure-play vertical SaaS at similar growth and margin, not Salesforce or Microsoft, which trade on platform dynamics at a different scale.
The standard multiple is EV/EBITDA on a forward basis. For higher-growth businesses with thin EBITDA, EV/Revenue with an implicit margin assumption. For financials, P/E. Forward, not trailing, because the market prices on future earnings.
Adjustments to EBITDA: strip out one-time items, treat stock-based comp consistently across the set, normalize for major pension or lease accounting differences. The most common mistake is making adjustments inconsistently: every adjustment applied to the target must be applied to every comp.
For the output, I'd present the range — 25th percentile, median, 75th percentile — and pick where the target sits based on its position on growth, margins, and scale relative to the set. The median is the default; the senior question is always whether the target deserves a premium or discount, and why.
Finally, comps are one piece of a triangulation alongside precedents and DCF. The answer is the range, not the median multiple times EBITDA."
About 100 seconds spoken at a measured pace. Hits the three layers, names the multiple hierarchy, flags the adjustment principle, lands on triangulation.
Where to Drill
The Analyst-level interviewer on HARDO drills the mechanics: selection criteria, adjustment standards, multiple selection. The Associate-level interviewer drills the defense — "why this comp, not that one," "where does the target sit and why," "what would change your view." Trading comps are deceptively easy until someone challenges every line of the set. The reps are how you build the muscle to defend it.
Reading is reps. Now take the rep.
Drill this in a mock- Knowledge HubHow to Answer Due Diligence Questions in an Investment Banking Interview
Due diligence is the IB interview category with no formula. What QoE reports actually check, the working capital peg, and how to prioritize red flags.
- Knowledge HubHow to Handle an IB Interview Question You Didn't Prep For
Investment banking interviews always include a question you didn't prep for. How to handle the miss without bluffing, freezing, or surrendering.
- Knowledge HubFirst-Round vs Superday: What Actually Changes
First-round and superday are not the same interview at harder difficulty. What actually changes between them, and how to prep for each